
Solve the issue – Python’s Matplotlib plotting in wrong order is a Python issue which occurs when you are trying to use Matplotlib to plot but you are doing it the wrong way.
In this article I am going to help you solve ans understand the ploting issue while I try explaining why you are getting the wrong results.
I will also introduce some solutions which worked for other developers and we will see if those solutions can solve the issue in your unique situation.
Explaining the Error : Python’s Matplotlib plotting in wrong order
As we already said, the issue happens when you try to use Matplotlib to plot but you are doing it the wrong way.
The issue has no error message you will jus get messy plots and results you are not expecting.
In the sections bellow we will explain the root of the error more and propose some possible fixes.
Solution 1 : using zip
There are a lot of ways to make a mistake or do the plotting wrong with matplotlib.
When Matplotlib is plotting in the wrong order, just know that you are not doing the right things, maybe you are but you are making a mistake along the way.
Let us say you have two arrays one containing the values of the x-axis and the second contains the values of the second axis aka the y-axis.
If you want to sort the two arrays so that the x array and the y array are both sorted by increasing values then you should try zipping, sorting then unzipping both arrays.
You can do that using the code bellow.
                                                                       #
xs = [2, 6, 10]
ys = [10, 6, 2]
xs, ys = zip(*sorted(zip(xs, ys)))
plot(xs, ys)
                                                                       #
This is the result we will get.
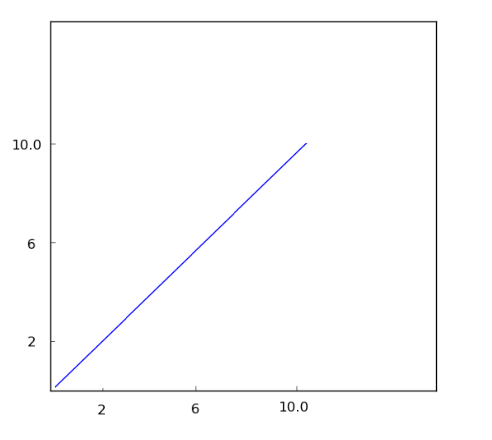
Notice how both arrays have been sorted from the smallest to the biggest number, this is exactly the result we were looking for.
Solution 2 : using numpy arrays
This is a solution that I did not try while doing my research, but it is worth to note that as an alternative to the first solution you can convert your arrays to numpy arrays.
Sort the first aray by using argsort and then sort both using argsort just like we did above but this time you can use argsort,
Read more about argsort by following this link : https://numpy.org/doc/stable/reference/generated/numpy.argsort.html
If the solutions above helped you, consider supporting us on Kofi, any help is appreciated.
Summing-up
Finally, we are at the end of this article, I hope this article has been helpful, I hope you solved your problem: Python’s Matplotlib plotting in wrong order, coding can be hard when you have a lot of confusing errors here and there.
Thank you for reading, keep learning and keep coding, cheers. If you want to learn more about Python, please check out the Python Documentation : https://docs.python.org/3/